
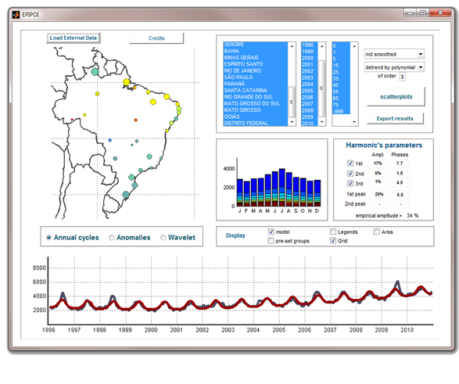
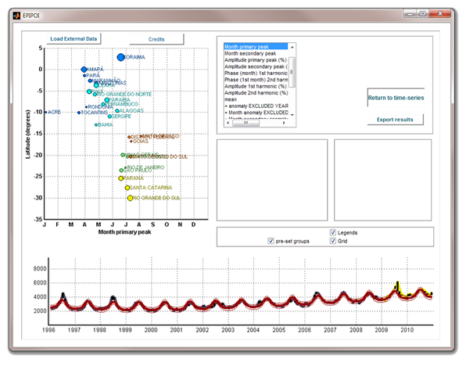
Visualize and extract automatically (right after loading the data) important seasonal and trend parameters from your series, and plot them on a map
DOWNLOAD
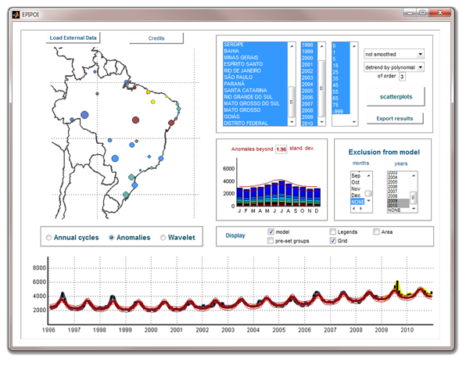
Inspect anomalies within periods of your choice, e.g. pandemic years (the program automatically excludes those years from a baseline model)
DOWNLOAD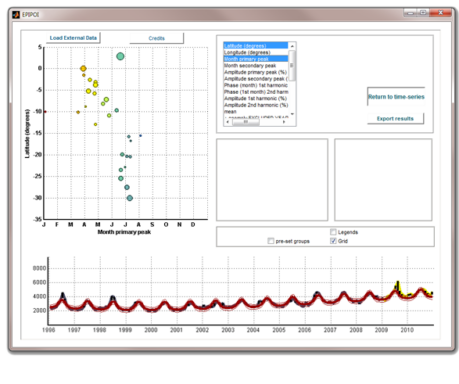
Plot automatically the parameters extracted from your series in latitudinal or longitudinal gradients with the click of a button
DOWNLOAD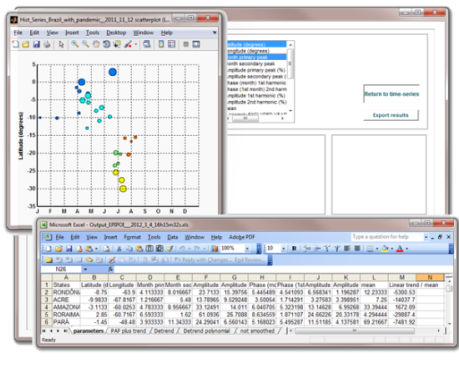
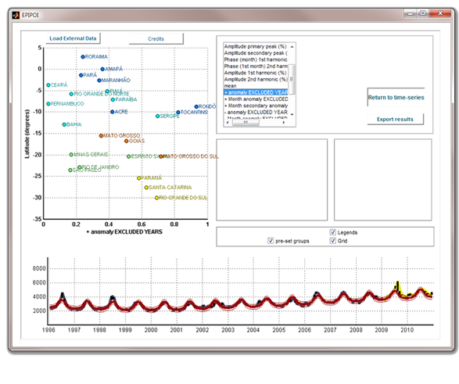
Legends are extracted from the tables with your data, and graph colors can represent pre-established aggregations
Parameters representing anomalies can be compared among locations (e.g. in this figure, the gradient of excess mortality of 2009-2010 compared to the model built for non-pandemic years)
DOWNLOAD